
Table of Content
Modern businesses are cranking out massive amounts of customer, sales, operational, and financial data every single day, yet many organisations still have trouble in turning that data into real, practical business intelligence. It’s like the information just hangs around inside ERP systems, spreadsheets, separate reports and manual workflows. Even when the numbers are there, organisations often struggle to transform them into actionable insights through ERP data visualization Business Central capabilities, resulting in slow and fragmented decision-making. So, it becomes hard to spot trends, predict customer behaviour, or make confident decisions in time.
This is where the Business Central Power BI integration turns into a real business advantage. When you combine Microsoft Dynamics 365 Business Central with Microsoft Power BI, organisations can reshape raw ERP data into visual insights, near-real-time dashboards, and predictive analytics models all of that helps teams make faster, smarter decision-making without waiting on slow cycles.
Today’s businesses don’t just want old numbers on a page.
They want to forecast demand, sort out customer buying patterns, find those revenue opportunities sooner, and react a bit more proactively to shifting market conditions, basically. With Dynamics 365 Business Central analytics, companies can move away from reactive reporting toward a proactive, data driven approach, more or less on demand but still with intention.
In this blog, we will look at how connecting Power BI with Business Central can help businesses unlock customer insights, improve forecasting, tighten operational visibility, and strengthen predictive analytics across different departments.
Challenges Solved by Business Central Power BI Integration
- Eliminating Manual Reporting
- Breaking Data Silos
- Improving Forecast Accuracy
- Accelerating Decision-Making
What is Microsoft Dynamics 365 Business Central?
Microsoft Dynamics 365 Business Central is basically a cloud-based ERP platform, made so small and mid-sized businesses can run things smoother. It enables organisations to sort out finance, supply chain, inventory, operations, projects, sales, customer service, and reporting all inside one unified space without too many separate systems.
Business Central also centralises company data across departments, which usually means operational consistency becomes simpler to keep, and process efficiency tends to improve. That said, even though the platform includes built-in reporting, many organisations still end up wanting more advanced analytics, clearer visual dashboards, and predictive intelligence, so they can pull deeper business insights from their day to day numbers.
What is Microsoft Power BI?
Microsoft Power BI is sort of a business intelligence, and analytics platform that helps organisations visualise their data, set up interactive dashboards, churn out reports, and spot trends using AI-driven analytics, you know. It basically connects to all sorts of data sources, like Dynamics 365 Business Central, Excel, CRM systems, cloud applications, and even third-party platforms, as well. From there it turns complicated datasets into visual reports that are easier to read , and that in turn can back up better business decisions.
So when you bring Business Central and Power BI together, they form a clever data environment, and it can deliver predictive analytics and real-time business clarity, at the same time.
Why businesses need predictive analytics today ?
Most of the time traditional reporting, is mostly about what already happened. Teams look at last month, last quarter, or last year, and they ask “what did we do ” rather than “what will happen next”. Predictive analytics ERP capabilities help companies respond to these challenges by combining historical ERP information, AI models, customer behaviour patterns, and trend forecasting to support more informed decision-making. Yes, historical reporting helps, but it usually does not really cover the forward looking stuff, the questions that matter when time is moving and decisions need to be made quickly, like:
Key Business Questions Answered with Predictive Analytics
- Which customers are most likely to repeat buy again?
- Which items might see demand drop off soon?
- What revenue levels are we likely to hit next quarter?
- Which customers are getting close to churn?
- How can stock shortages be anticipated before they actually show up?
- Which leads are most apt to turn into real sales?
Predictive analytics lets companies respond to all that by combining historical ERP information, AI models, customer behaviour patterns and forecasting of trends. In practice, it makes the next step less of a guess and more of a plan.
Also, when organisations use ERP data visualization, especially the Business Central features together with Power BI, they can spot recurring patterns earlier and take corrective actions ahead of time, before minor issues grow into bigger ones.
Benefits of Business Central Power BI Integration
Unlocking Power BI Customer Insights with Business Central
1. Better data, less noise everywhere
One of the biggest wins when you connect Power BI with Business Central is getting a single source of truth across the organisation. Instead of switching between multiple apps or manually stitching data, leaders can bring finance, sales, inventory, procurement, and customer data into one interactive dashboard.
2. Near real-time reporting
With Business Central Power BI integration, dashboards refresh in near real-time so KPIs can be monitored continuously. This allows organisations to react faster to market changes and evolving customer behaviour.
3. How Dynamics 365 Business Central Analytics Strengthens Customer Insights
Customer expectations keep changing rapidly. Businesses need to understand buying behaviour, engagement patterns, and preferences to stay competitive. This is where Power BI customer insights become essential.
4. Customer segmentation
- Purchase history
- Industry
- Geographic location
- Revenue contribution
- Buying frequency
- Product preferences
- Payment behaviour
5. Spotting high-value customers
- Repeat purchase behaviour
- Average order value
- Long-term profitability
- Customer retention patterns
This helps sales and marketing teams focus on high-value accounts and strengthen retention strategies.
6. Predicting churn before it happens
- Reduced order frequency
- Delayed payments
- Declining engagement
- Lower purchasing volumes
To explore how Power BI and Dynamics 365 Business Central can help your business move faster, make better decisions, and grow profitably.
Power BI visualisations make these patterns easier to identify early, allowing businesses to take proactive retention actions.
ERP Data Visualization in Business Central
ERP data visualization Business Central capabilities make data easier to interpret through dashboards, charts, and reports. This allows faster decision-making and better operational visibility.
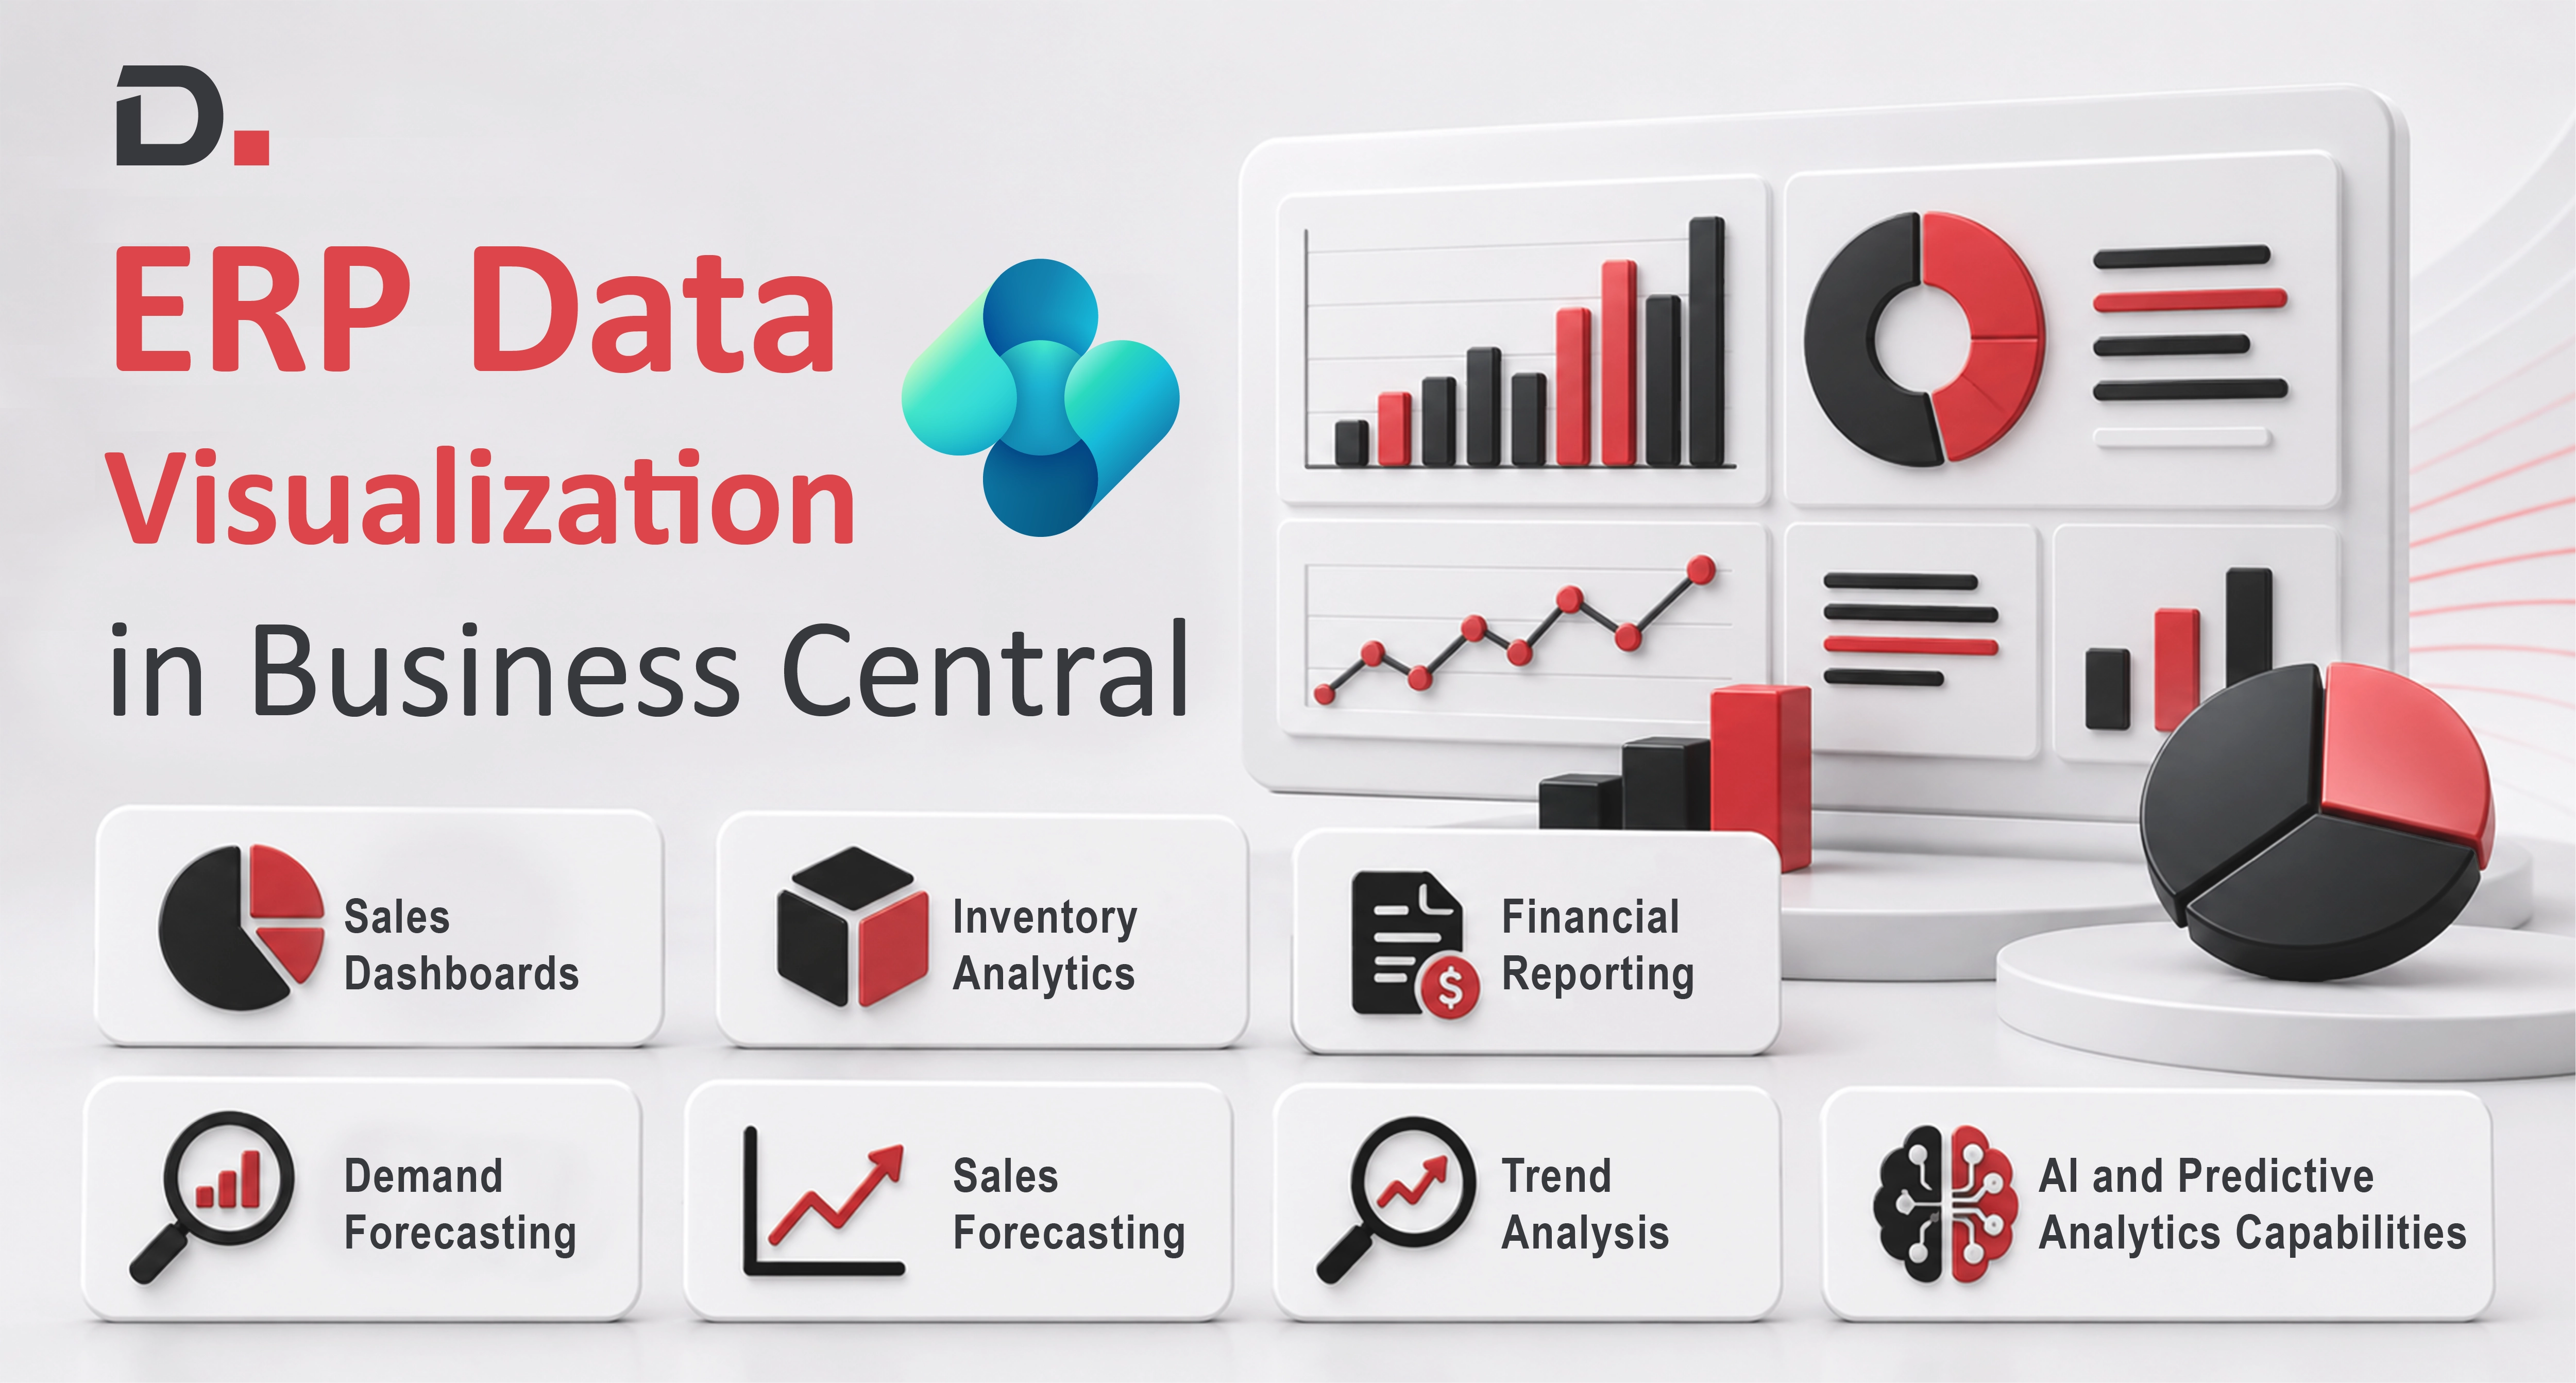
1. Sales Dashboards
- Monthly revenue trends
- Top-performing products
- Regional sales performance
- Sales pipeline health
- Conversion rates
- Forecast accuracy
2. Inventory Analytics
- Stock availability
- Inventory ageing
- Warehouse performance
- Product movement trends
- Overstock risks
- Reorder recommendations
3. Financial Reporting
- Profitability analysis
- Budget variance
- Cash flow forecasting
- Expense trends
- Revenue performance
- Financial KPIs
4. AI and Predictive Analytics Capabilities
Power BI comes with built in AI and machine learning features. That means organisations can go past descriptive analytics, and do more guided, forward-looking analysis.
5. Demand Forecasting
You can forecast future demand using historical sales data that’s already kept in Business Central. Predictive forecasting supports organisations to-
- Plan inventory more accurately
- Reduce stock shortages
- Avoid overstocking
- Improve procurement planning
- Handle seasonal demand changes
6. Sales Forecasting
- Future revenue
- Pipeline conversion rates
- Sales cycle duration
- Product demand trends
7. Trend Analysis
- Seasonal purchasing trends
- Regional demand variations
- Product performance fluctuations
- Customer buying cycles
Industry Use Cases of Dynamics 365 Business Central Analytics
Manufacturing
Manufacturers tend to rely on Dynamics 365 Business Central analytics in a more practical, almost day to day way for-
- Production planning
- Demand forecasting
- Supplier performance tracking
- Operational efficiency monitoring
Distribution and Wholesale
Distributors often put Power BI dashboards to work to keep an eye on-
- Order fulfilment
- Inventory turnover
- Customer profitability
- Delivery performance
Professional Services
Service based organisations analyse things like-
- Project profitability
- Resource utilisation
- Client engagement trends
- Revenue forecasting
Improving Decision-Making Across Departments
Sales Teams
Sales managers get visibility into:
- Lead conversion
- Revenue opportunities
- Customer buying habits
- Sales forecasting
Finance Teams
- Automated reporting
- Budget forecasting
- Financial trend analysis
- Real-time profitability awareness
Operations Teams
- Inventory movement
- Supply chain performance
- Procurement efficiency
- Warehouse activities
Executive Leadership
- Overall business performance
- Revenue growth
- Operational KPIs
- Customer analytics
- Strategic forecasts
Why Microsoft Ecosystem Integration Matters
Business Central integrates seamlessly with Power BI, Microsoft 365, Excel, Teams, Azure, and other Dynamics 365 applications. This connected environment improves productivity, collaboration, and data accessibility across the organisation.
Future of Predictive Analytics in ERP Systems
ERP systems are evolving into intelligent decision-making platforms. Predictive analytics powered by AI and machine learning is becoming a core capability, enabling automated forecasting, real-time intelligence, and smarter business insights.
Integrating Power BI with Business Central helps organisations unlock these capabilities and gain long-term value from their ERP investment.
Conclusion
With Business Central Power BI integration, organisations can transform operational data into actionable insights using real-time dashboards, predictive analytics, and advanced reporting.
By combining Dynamics 365 Business Central analytics with ERP data visualization, businesses gain deeper customer insights, improve forecasting, and drive sustainable growth.
Want to unlock the full potential of your ERP data? Reach out to our experts


Searching for a Localised Business Central Implementation Partner?
Stop searching for a Business Central Implementation Partner! Our Australia-backed committed partner who understands your business is here to make your implementation seamless and efficient.
Disclaimer– “All data and information provided on this blog is for informational purposes only. Dynamics Square / MPG Business Information Systems Pvt. Ltd. makes no representations as to accuracy, completeness, currentness, suitability, or validity of any information on this site and will not be liable for any errors, omissions, or delays in this information or any losses, injuries, or damages arising from its display or use.”


